

 AA
AA CC
CC AP
AP AG
AG DM
DM PM
PM Fahad KhanDigital Marketing Manager, Ubuy Sweden
Apply Last-Used Threshold With Deprecation Banner
We enforced a strict "last-used" threshold to retire a dashboard and that lead to zero views or queries over 90 days. As a data analytics and operations executive for 4 years, I have seen teams building reporting views for temporary projects. But the dashboards stay active after projects end. This creates noise and leaves outdated metrics. We treat dashboards like software. It means they must justify upkeep through consistent usage.
The practice that made retirements smooth is the "deprecation banner test." We place a banner instead of deleting outright. It highlights, "This report will be retired on [Date]. If you use it daily, click here to claim ownership. Otherwise, it will be removed automatically."
This improved efficiency for our data team last quarter. We found 120 stagnant dashboards. After 30 days of warning banners, we deleted 85% with zero complaints. That saved 15 hours weekly and cutting clutter by 40%.
Andrew AlexCEO, SpendbaseShut Down Idle Or Nonfinancial Panels
Most internal dashboards are just vanity projects burning expensive cloud compute.
At Spendbase, we don't hold stakeholder meetings to debate whether we should retire a dataset. We just look at the logs.
If a dashboard hasn't been accessed in 30 days, or if it doesn't directly tie to a financial decision, we just turn it off.
It's the classic "scream test." If that data was actually delivering business value, someone will immediately complain and we turn it back on. 99% of the time? Absolute silence.
Carlos CorreaChief Operating Officer, RingyDrop Corrupted Signal And Show Authenticity Risks
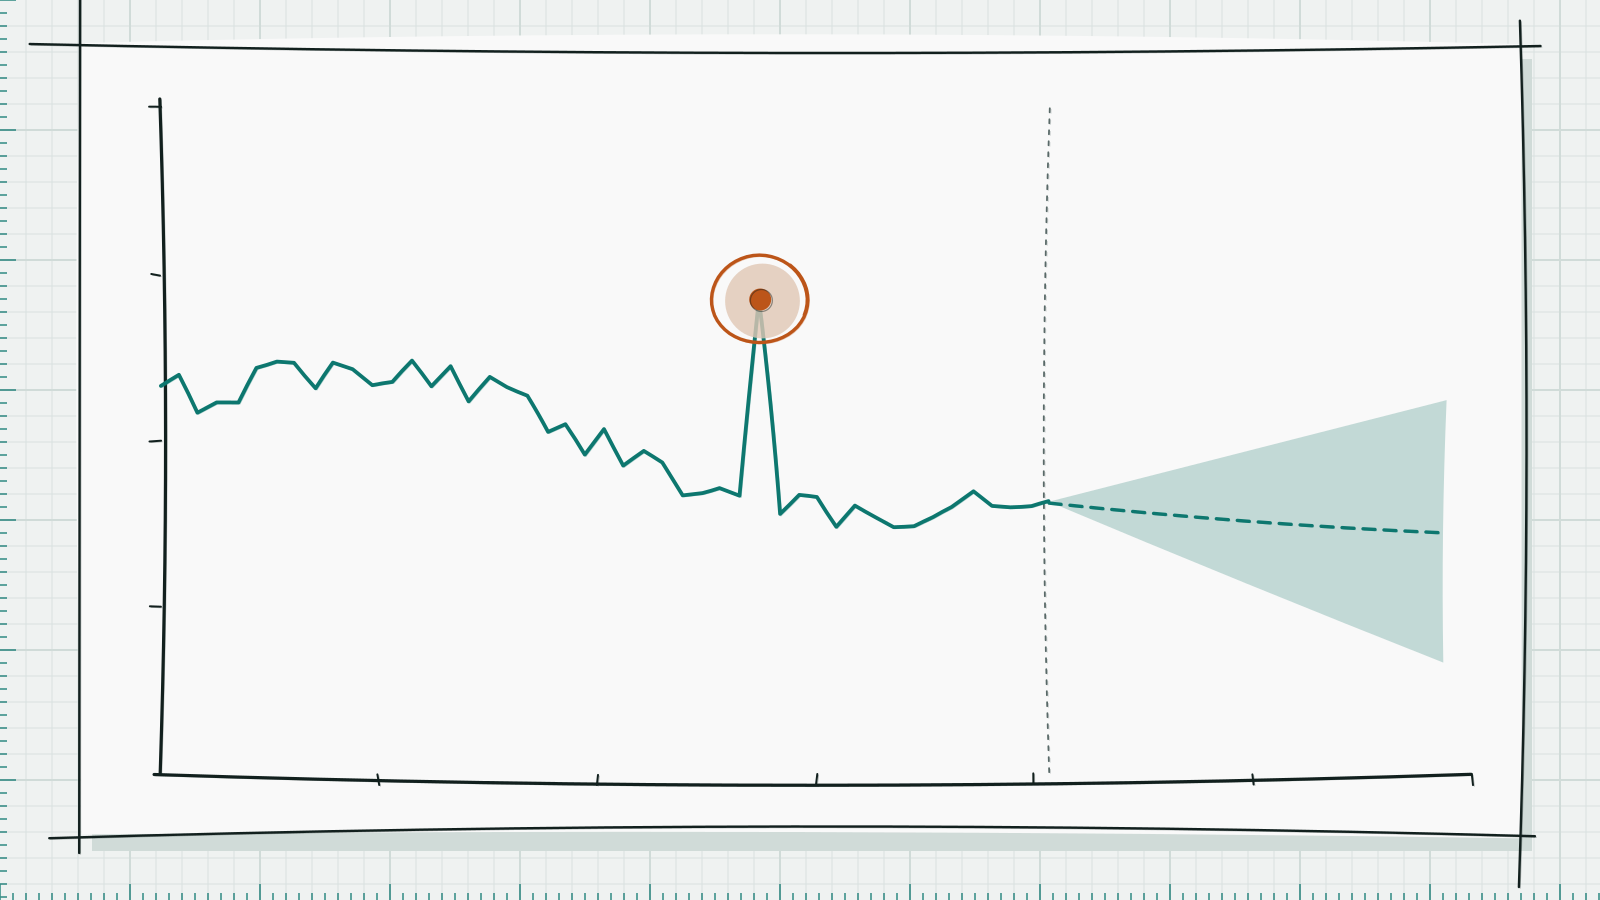
The most definitive criterion to retire an analytics dataset/dashboard is when there is a degraded signal-to-noise ratio, and the dataset is unable to filter out artificial amplification.
As more and more organizations roll out social listening + sentiment dashboards, you end up with the need for this specific type of dataset because it's continually subjected to manufactured outrage. I've seen it in the industry multiple times where a leader will react to a large spike in negative sentiment only to later figure out the data is poisoned.
If you can't filter out all the fake bot messages from an analytics asset so that it can't differentiate real stakeholder feedback from fake, it's not servicing the business as a tool; it's actually causing real business risk, and it must be retired.
The reason I mention this as an important criterion is that it is very easy to retire these legacy dashboards as part of a broader portfolio management effort if you shift the conversation from a signal about "infrastructure optimization" to "let's educate on the dataset's authenticity." You don't just tell people that you're sunsetting a particular asset to try to save some infrastructure uptime; you educate them with a specific and nuanced assessment about how this old dashboard is giving them an incorrect and harmful view of their reality.
Once the BI leaders start showing the negative sentiment spike and then start showing all the artificial amplification that's going on, explaining that if you react too quickly to these bot-driven metrics, you'll actually cause more attack metrics to fire off. Then all of a sudden you're able to retire the dashboard with very little pushback.
As such, you end up retiring the dashboard, but then you put the filters on and do all the bot detections in the crisis playbook, and then the executives are all safe to make decisions based on the human reality.
Aigars PilmanisFounder, VolRadarRemove Views That Never Change Choices
This observation occurs at VolRadar, which is the options analytics platform that I manage. It is often the case that dashboards which decay are not the ones that users do not open, as those are removed quickly—but there is danger in dashboards that people view out of habit without taking any action.
On that account, the signal for retirement that I monitor is not user traffic. It is if a view has altered one decision during the most recent quarter. If it has not influenced a single choice, it is data that appears to be useful but provides no value.
To ensure that the removal process is easier for stakeholders, I rephrase the inquiry. As an alternative to asking if we can delete a dashboard, I ask which specific decision the dashboard supports and if people still make that decision in this location. When the owner identifies the decision, they usually recognize that the process relocated months ago. And they permit the removal because they no longer require the tool.
We provide data at the end of the day rather than in real time for this reason. By increasing the frequency of updates, we were causing users to mistake constant changes in data for meaningful trends.
Ankush GuptaFractional CMO, Fameninja ORM Management CompanyArchive After Requester Silence For Ninety Days
We retire a dashboard when the last person who asked for it stops opening it for 90 days. That single criterion removes the guesswork.
At our ORM work, we run client reporting dashboards showing coverage, sentiment, review scores, and search result position. Early on, we built every requested view. Clients asked for competitor comparisons, monthly trend lines, regional breakdowns, and historical snapshots. We said yes to all of it. Within six months, we were maintaining 40 different report templates across 15 clients, and most of them were never opened after the first week.
We added a tracking layer using Google Analytics events on every dashboard. Each view logged when it was opened, by whom, and for how long. After three months of data, the pattern was clear. About 60% of dashboards had zero opens in the prior 30 days. Another 20% were opened once, then ignored. The remaining 20% were used weekly.
The 90-day rule came from that audit. If no one opens a dashboard for three months, it gets archived. Before we archive, we send one email to the original requester and the account owner with a 14-day notice. The email includes a screenshot of the last-opened date and a single line: "We're retiring this view on [date]. Reply if you still need it."
Out of 24 retirement notices sent in the first round, we received two replies asking to keep the dashboard. Both were legitimate. One was a quarterly view used only at board meetings. The other tracked a crisis metric that had stabilized, so the client stopped checking daily but wanted it available if the issue resurfaced.
For the 22 dashboards we retired, no one objected. The lack of pushback told us the real story. People request dashboards when they think they need data, not because they will use it. Showing them the usage log removes the emotional argument. It's not our opinion that the dashboard isn't useful. It's their behavior.
The secondary benefit was maintenance cost. Every schema change in our automation pipelines required updating every active dashboard. Cutting the portfolio from 40 to 18 meant schema migrations went from two days of work to half a day. That freed up capacity to improve the dashboards people actually opened.
One lesson from this: the smoothest retirements happen when you show people what they already know but haven't admitted. Usage data removes debate. If they argue the dashboard is critical but the log shows three months of silence, the conversation ends quickly.
Dane MaxwellFounder, Paperless PipelineCull Features That Don't Drive Action
I run a software product, so I treat dashboards and datasets the same way I treat features, and features nobody uses are a liability, not an asset.
My criterion for retiring one is simple. If it isn't driving a decision, it goes. A dashboard people glance at but never act on is pure upkeep cost with no return, and worse, it adds noise that makes the useful signals harder to find. I'd rather have a few reports people change behavior over than a wall of charts nobody trusts. Usage without a resulting action is not a reason to keep something alive.
What made retirements smoother with stakeholders was tying the review to our six-week release cadence, so pruning became a normal, scheduled thing rather than a threat. Each cycle we'd ask what hadn't influenced a decision, and sunset it on a known timeline with warning, not by yanking it overnight. When it's routine, people stop treating their dashboard like territory.
The reframe I'd offer is that keeping a stale report feels free and isn't. Every artifact you maintain is a small tax on attention. Retiring aggressively is how you keep the survivors credible.
Pratik MahajanSr. Analytics Solutions AssociateKeep Artifacts That Shift Outcomes And Consolidate Elsewhere
The single criterion that works for me is usage tied to a decision. Before retiring anything, I ask one question: has this dashboard changed a decision in the last quarter? Server logs tell you views, but views are not value — I have seen dashboards opened weekly out of habit while the actual decision was being made from a different report entirely. If nobody can name the decision it supports, it goes on the retirement list.
The usual practice that makes retirements smoother is to consolidate before deleting. In a previous role, I consolidated 23 manual Excel reports into a single automated dashboard. Nobody fought that retirement, because the stakeholders were not losing something — they were trading many half-maintained views for one reliable source. People do not like to lose a report, but they are fine with an upgrade. So when I have to get rid of a dashboard, I do not say "this dashboard is going away". Instead, I show them where they can find the information now. I keep the old and new ones running at the same time for a few weeks. Then, when nobody is using the old one anymore, I can just let it go without anyone noticing.
The upkeep point is also important. Every dashboard has costs: regular refreshes, checking data and answering questions when numbers seem wrong. I handle refreshes for dashboards in different regions. Each retired dashboard is one less thing that could go wrong at 6 a.m. before a leadership meeting. A smaller set of dashboards that people trust is better than a large one that they have stopped paying attention to.