
§ How this was made
The perspectives in this article were written by the named contributors and submitted through Connectively. Connectively's automated system selected them and used AI to write the headline, introduction, section headings, summary sections, and illustration, and to make minor edits for clarity. Articles are assembled and published automatically. Report errors to corrections@connectively.us. How we make our content
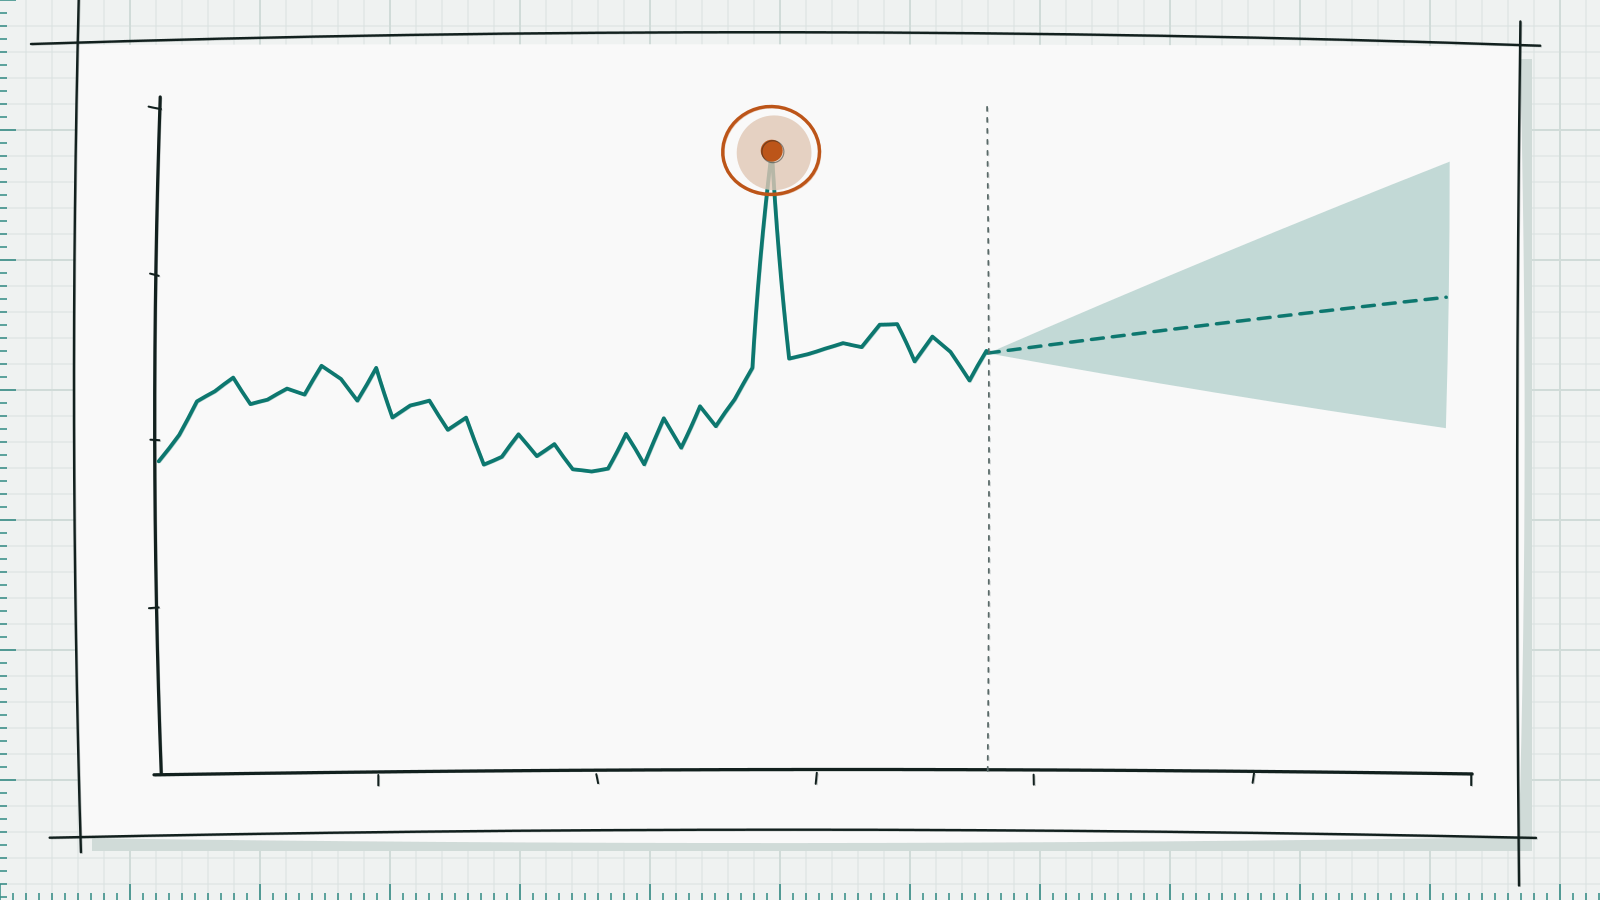
Illustration generated with AI
 IL
 JD
 RA
 RS
 JH
 SA
 SM
 Ace ZhuoCEO | Sales and Marketing, Tech & Finance Expert, TradingFXVPS
Tie Estimates to Trigger Points
1. Communicate exactly as much uncertainty as would change a decision and NOT ONE BIT MORE. A forecast of 400-600 new VPS deployments by end of quarter for example might result in ordering same amount of hardware for either end of range, so in this case a single number would be sufficient. But a range of 400-600 would indicate that 400 more VPS would mean adding another rack to an existing cage of VPS, while 600 more would mean adding an entirely separate cage of VPS in a completely different datacenter. Stakeholders would be SICK to death of so much unnecessary uncertainty that does not matter and ALL model caveats and data quality concerns get relegated to an appendix that NO ONE will read.
2. Tie every estimate to a tripwire. I remember at TradingFXVPS when we were deciding whether to add capacity to our London-based VPS for our broker clients and the demand estimates were very rough. Instead of saying we expect 70% utilization, I said: "My best guess is 70% but my realistic range is 55% to 85%. We'll buy half the needed hardware today. If utilization is above 75% for two weeks then we automatically order the second half of the hardware. But if we're below 50% by week 6 then we stop." That way the team never argued about whether 70% was correct or not. We all knew that we were wrong already and that was priced into the estimate. And once the estimate became a fact then it was no longer a fact. We had already spelled out what to do when it inevitably broke. So tie a plan B to the estimate and people will use the estimate correctly.
Ihor LavrenenkoFounder, SmarflePair Ranges With Clear Recommendations
I match the amount of uncertainty I share to the decision at hand. If the choice is cheap and reversible, one line of caveat is enough. If it is costly or hard to undo, the stakeholder needs the range and what drives it.
My format is a number, a range, and a recommendation. For example, "Organic leads will likely land between 80 and 120 next month, our best guess is 100, and I'd plan staffing for 90." The range shows the estimate is not a fact, and the recommendation tells the reader what to do with it.
In SEO and marketing reporting I see this constantly. A rankings forecast or an attribution report looks precise, and people treat it as exact. I label what we measured directly (clicks from Search Console, calls logged in the CRM) separately from what we modeled (projected traffic, assisted conversions). Stakeholders then know which numbers they can rely on.
I also state what would change my mind. "If conversion rate drops under 2% in the first two weeks, we revisit the plan." That gives people a trigger to act on, so uncertainty turns into a plan rather than a reason to stall.
I keep the method details in an appendix. Most readers want the range and the next step.
Ihor Lavrenenko, Founder, Smarfle (smarfle.com)
Jörg Dennis KrügerAuthor, Expert and Mentor, The Conversion Hacker®Set Rules Before Tests
The rule I use: communicate the decision, not the decimal. Stakeholders do not need the confidence interval. They need to know which way the evidence points, how wrong it could be, and what happens if we act and it is wrong.
Practically that means three sentences, in this order. What we think is true. How sure we are, in words tied to a number: this could be twice as large or half as large. And what we do either way. The third sentence removes most of the anxiety, because it turns the estimate into a reversible step instead of a bet.
The other half is timing. Decide the decision rule before the test, in writing: ship if the variant is better by more than this, keep control if the difference sits inside the noise, extend if it lands between the two. Afterwards the conversation is not about interpretation, it is about whether the rule was met.
One habit makes it credible: always quote the basis with the number. Our Gutta test measured +16.43% revenue per user across 5,286 users over 231 days. The runtime is part of the result. A percentage without its sample and its duration is a point estimate pretending to be a fact, and that is what makes stakeholders overconfident.
Cite Sources Behind Every Figure
The approach that worked for me is to show where each number came from, and to say plainly what a missing number means.
On a keyword research project for a dental clinic in Morocco, Google Keyword Planner returned no volume for "dentiste tanger", "dentiste rabat" and "dentiste marrakech". The same call priced "dentist tangier", the English spelling, at 210 searches a month, and returned 14,800 for plain "dentiste". A blank in that table did not mean nobody searches. Search Console had counted 14,614 impressions for "dentiste tanger" over nine months, and Ahrefs estimated 3,600 a month. Read as zero, that blank would have deleted the most commercial keyword in the account.
So every keyword in the deliverable carries the figure we used and the source that supplied it: the highest of Planner, Ahrefs, or Search Console impressions divided by the months. The reader can see which numbers were measured and which came from a different source.
A review also caught our own draft saying Planner had "no volume at all" for these searches, nine lines above a row that priced the English version. The precise claim is the one that belongs in the report: no volume for the French spelling, in that call. Of 4,274 city-based dental keywords we priced, 44 came back with any volume from Planner.
A leader can act on an estimate when they can see what it is made of and what it says nothing about.
Roman SurikovFounder & CEO, Ronas IT | Software Development CompanyPlace Qualifications Beside Charts
I put the uncertainty that could change a decision beside the chart itself. Stakeholders need to know what a measure misses and which conclusion it cannot support on its own. A long statistical disclaimer makes that boundary harder to use, especially once a striking visual has already set the tone.
At Ronas IT, we shared an annual view of commercial utilisation alongside a second series comparing revenue from someone's commercial project hours with their pay. Together, the series looked more positive than the audience had expected. In the same message, we warned that the comparison wasn't an objective assessment, particularly for senior engineers. People saw the favourable reading with the qualification attached. A senior engineer can contribute in ways that an individual commercial-hours measure doesn't capture, so a chart about that measure cannot settle a person's performance.
I decide how much uncertainty to explain by asking whether it could change the next action. A small change to the last decimal place can stay in the background. An assumption that could reverse the conclusion needs to be said aloud, as does a blind spot that makes an individual measure misleading. The warning was part of the interpretation at the moment people encountered the result, rather than a footnote to discover later.
Put the qualification in the first view of an estimate. Stakeholders can then act on a pattern without mistaking a partial measure for a verdict.
Jens HagelFounder & Owner, kjelloReveal Data Origins Before Conclusions
When we connected seven of our own systems at hagel IT, the company I founded, the contribution margin in our ERP turned out to be a factor of two away from the gross profit in our accounts. Since then I tell people that a wrong number is more dangerous than no number. Without a number you decide on gut feeling and know it, but with a wrong one you decide on gut feeling and call it analysis. So I'd always say where a figure comes from before saying what it is.
Jens Hagel, Founder & Owner, kjello (Hamburg, Germany)
Sahil AgrawalFounder, Head of Marketing, Qubit CapitalAdd Expiration Dates to Forecasts
When a number reaches whoever has to decide, I want it as a range with 2 things attached, the decision it is good enough for and the date it expires. Anything beyond that and people stop reading.
A founder we had paired with about 20 investors once treated our estimate of their reply time as a promise. We had said 3 to 6 weeks. She planned her cash around 3. That one was on us. Now an estimate like that goes out with a date after which you should stop trusting it. People seem to accept that from a weather forecast without any fuss.
Shoaib MughalFounder, Marketix DigitalDistinguish Evidence From Inference
We separate what the data shows from what the business can reasonably infer. Executives need enough certainty to make a decision, not the illusion of precision.
For example, our Australian pallet-racking research identified approximately 24,860 monthly commercial searches and estimated a $397 million annual market for new installations. We made the distinction explicit: search volumes were platform estimates, not unique buyers, and market value was a planning estimate, not verified revenue.
Those figures can justify investigating a commercial opportunity. They cannot establish how much revenue any individual business will capture.
Our approach is to communicate three things: what we know, what remains uncertain and what decision the available evidence supports. This keeps estimates useful without allowing them to become promises.
 Kruno SulićFounder & SaaS Product Builder, Cliprise
Link Projections to Thresholds
When data is informing an important business decision, I try to communicate uncertainty in proportion to the decision's reversibility and cost. For a low-cost, reversible choice, I keep it simple: the directional takeaway, the confidence level, and the next checkpoint. For a high-cost or harder-to-reverse decision, I add the range, the main assumptions behind it, and what could still change the outcome. The goal is not to dump every caveat on stakeholders. It is to make sure they understand what is solid, what is estimated, and what action is still reasonable.
What has worked best for me as a founder is a three-part format: what we know, what we estimate, and what we will do next. In product and marketing decisions, especially when testing new workflows or AI-driven content systems, I have found that people handle uncertainty better when you separate observed facts from modeled projections. For example, I might say, "We know this test improved click-through rate in this sample. We estimate the broader lift is likely in a range, not a single number. Based on that, we should expand carefully, not fully roll out yet."
One approach that helped stakeholders act appropriately was pairing every estimate with a decision rule. Instead of presenting a forecast by itself, I tie it to a threshold: if results stay above X after another sample period, we scale; if they fall below Y, we pause and rework. That keeps the conversation focused on action rather than false precision. It also prevents a projected number from being repeated later as if it were an established fact.
I have also learned that visuals matter. A single number in a slide tends to become "the answer." A range, confidence label, and one sentence on the biggest uncertainty keeps people grounded. In my experience, stakeholders do not need every statistical detail. They need a truthful level of confidence, the main source of risk, and a clear recommendation for what to do next.
 Hasan Can SoygökFounder, Remotify
Separate Cash Plans From Available Funds
I communicate uncertainty in terms of the decision it could change, rather than presenting every caveat behind the analysis. In cash-flow planning, I distinguish forecast payment dates from money already in the bank. My decision notes identify the expected amount, the main assumption and the action required if that assumption fails. For example, a team can proceed with essential delivery costs while delaying optional spending until a large receivable clears. This gives stakeholders a clear trigger to revisit the plan without treating an estimate as a guarantee.
 Kyle BarnholtCEO & Co-founder, Trewup
Use Scenarios to Guide Choices
We avoid presenting uncertainty as a warning and instead explain its practical impact. We use a decision table covering expected, adverse, and favorable cases to clarify possible outcomes. For each case, we outline the action, financial exposure, and evidence needed to move forward. This approach turns abstract probability discussions into clear choices that stakeholders can understand and own.
During a margin review, our initial estimate suggested a significant leakage issue, but the source documents were inconsistent. We approved an investigation and paused only commitments that relied on the estimate being accurate. We kept unrelated activities moving to avoid unnecessary disruption. By limiting action to the adverse case, we avoided overreaction and false certainty while ensuring our decisions reflected the strength of available evidence.

Expose Assumptions and Assign Owners
A useful estimate should never arrive without its operating assumptions. In partnership settings, stakeholders often remember the headline number but forget the conditions that made it plausible. That is where confidence becomes accidental overcommitment.
My preferred approach is to present the estimate alongside a short assumption ledger, including capacity, response quality, approval speed, and market stability. Each assumption has an owner and an early warning indicator. During a period of uneven client turnaround times, this method showed that projected output was achievable only if approvals stayed within a defined window. Leadership did not reject the forecast, but adjusted the timeline and assigned escalation ownership. The estimate remained useful because its dependencies were visible and manageable.
 Richard MeadowsHead of Content, Streamrise
Label Claims by Evidence Type
The approach that works for us at Streamrise is to label every claim with how we know it, rather than to describe uncertainty in words. Each statement in a report is tagged as one of three things: measured (we ran the check and here is the number), estimated (here is the reasoning, and here is what would change it), or no data. Stakeholders do not need a lecture on confidence intervals. They need to see, at a glance, which sentences they can act on.
Two moments where the labels changed what people did:
1. A cause that sounded measured but was not. On 15 September an analysis explained that two orders had shown no activity for 49 hours because our monitoring had missed their start. It was well written and plausible. Labelled honestly, it was an estimate: nobody had checked the alternative. One query did: the customer had paused both orders through our API, and the pause timestamps matched the edges of the gap exactly. The lesson: it should have carried the estimate label from the start.
2. A mechanism that worked and an effect that did not. A product setting was verified as running exactly as built, 77 to 105 times every 15 minutes. The outcome it was supposed to change did not move. Reported as one line, "the feature works", it would have been treated as a success. Reported as two lines, "mechanism: measured, working" and "effect: measured, none", it made the gap impossible to miss.
What keeps this from overwhelming people: - The labels go on the claims, not in a separate section. A reader skims the measured lines first and reads the reasoning only where they need it. - "No data" is an acceptable answer. Nobody is punished for it, so nobody rounds it up to a guess. - Every estimate names the check that would settle it. That turns uncertainty into a next step instead of a worry. - Forecasts carry a date and a threshold for being wrong, so they can be checked later rather than argued about.
The aim is simple: people act on the measured lines, ask for checks on the estimates that matter, and stop treating a confident sentence as if it were a measurement.
 Amy NeckermannCEO, Sequenex
Keep Conditions Attached to Numbers
My rule is that the qualifier has to travel with the number.
This came from watching what happens to estimates inside an organization. You give a range with conditions attached; it goes into a slide; the slide goes into a board deck; and three versions later, the range becomes a single number, and the conditions disappear. Nobody did anything dishonest. The qualifier simply did not survive being copied.
So we attach the condition to the figure itself rather than putting it in a footnote or saying it out loud in the meeting. Not six to ten weeks, with a caveat mentioned once. Six to ten weeks depending on complexity, as one phrase, every time it appears. If the condition cannot survive being repeated with the number, it will not survive at all.
The second practice is to say what is known and what is not, as a split rather than a hedge. When we describe capabilities, we separate what is in use today from what is in development, and we label both. It is tempting to blur that line, because the blurred version sounds stronger. It isn't stronger with a buyer who checks, and in our field, the ones who matter do check.
I avoid treating uncertainty as a volume dial, where being more careful means saying more. Stakeholders do not need the full error analysis. They need to know which direction they would be wrong in and what would change the answer. Two sentences usually cover it.
The test I use is whether someone could act on what I gave them and later feel misled. If the honest answer is yes, the problem is not that I said too little about the uncertainty. It is that I put it somewhere it would get dropped.
 Jimi PatelDirector, eStore Factory LLC
Compare Inventory Risks Across Cases
My rule is to communicate uncertainty in terms of the decision, not the model. Stakeholders rarely need a confidence interval. They need to know which way the decision should lean if the estimate turns out wrong.
Q4 inventory on Amazon is the clearest example. Sellers have to send stock to FBA weeks ahead, and once a shipment is created against capacity limits it is hard to walk back. A demand forecast built from last year's Business Report data, the current sessions trend and Search Query Performance volume will always carry a wide range.
So instead of one number, I present three: the conservative case, the expected case and the case where we run out. Then I attach the cost of being wrong in each direction. Overstock means monthly storage fees, the aged inventory surcharge once units pass 181 days, and cash tied up into Q1. A stockout means lost sales in the highest traffic weeks plus the organic rank a listing loses while it is out of stock, which can take weeks to rebuild.
Framed that way, the founder can see the two risks are not symmetrical and pick a quantity inside the range with open eyes. Nobody treats the midpoint as a fact, because the conversation was never about the midpoint.
The other habit that helps is naming the one or two assumptions that would move the number most, such as a Lightning Deal getting approved or a key competitor restocking, and agreeing on a date to check them. That turns uncertainty into a short watch list instead of a vague warning people learn to ignore.
 Razvan LucaFounder, Talval Research
Show Valuation Spreads, Not Points
I publish fair-value estimates for about 1,000 stocks, so this is most of the job. A few habits that work.
Show the disagreement, not just the answer. Every company page shows each method's figure (a discounted cash flow, Graham's formula, sector multiples, forward earnings) next to the blended one. When they land close together, a reader can lean on the blend. When one says $40 and another $90, the spread is the message, and no paragraph of caveats would say it as fast.
Make the verdict a band, not a point. "Fairly valued" covers a range around the estimate, so a price a few percent away doesn't flip anything. A point estimate invites people to trade the decimal.
Blank beats zero. If an input is missing we show a dash, never a 0, because a zero is a claim. We learned that in August: a missing profitability figure was read as zero inside one quality check, and 16 companies got valued as if they'd failed a test they never took.
The phrasing that helps most is the smallest change. "I get fair value around $25" instead of "it's worth $25". Same number, but it tells the reader there's a method and a person behind it, and it invites the right follow-up question: what did you assume?
 Scott StoufferCo-Founder + CTO, Market Brew
State Measurement Limits Up Front
I communicate the limitation that could change the decision, right beside the number. A useful summary states what was measured, what it cannot establish and what action is justified.
In our QA work, roughly 3.3 calendar hours from testing readiness to first approval pushed me to shorten AI-generated specifications and responses. A retrospective audit of 106 items with business colleagues assigned as testers found that median turnaround. It includes waiting time, nights and weekends. It is not continuous hands-on testing time or a measured improvement after the writing change.
That distinction matters to the decision. The finding supported examining the handoff and making instructions easier to use. It did not establish that colleagues spent 3.3 hours actively testing each item, or prove how much time shorter writing saved.
My recommendation is to attach one decision-relevant qualification to the headline figure, then separate the observation from the proposed response. People can act on imperfect information when they understand the boundary of the claim.
 Vishnuvardhan Reddy KaithapuramSoftware Development Engineer, Amazon
Validate Data at Pipeline Boundaries
Take one defect - a column renamed by an upstream team, or the loss of 20% of a day's events due to partial outages. If detected at ingestion, the cost is a quarantined batch and a downstream discussion. But if detected a day later in an executive dashboard, the cost is reprocessing all downstream tables, invalidating cached aggregates, rerunning downstream models, and repairing the confidence of everyone who saw a wrong number. One defect, two scenarios, and vastly differing costs. The value of reducing detection latency far outweighs the benefits of any individual detection technique.
Researchers realized this years ago, and this is why Amazon, having identified that data validation traditionally occurred manually while software validation was highly automated, invested in declarative, unit-test style quality validation that could scale to billions of rows of data by calculating metrics over incrementally ingested data. A separate team at Google arrived at a similar conclusion, finding that schema validation and skew detection should be treated as pipeline features, not manual ad-hoc processes. Data quality is pipeline code, and the lessons about test-driven development and infrastructure as code apply just as strongly to data as they do to software.
The failure modes which have proven most challenging to pipelines at scale fall into three broad categories, each of which has a technique particularly well suited to addressing it. Schema drift is when producers change what columns they write, or how they use existing columns, and requires explicit schema validation at the pipeline boundary to detect.
It helps to state what the data cannot prove alongside the estimate itself, in the same view, so stakeholders act on the number with its limits in front of them.
— Vishnuvardhan Reddy Kaithapuram, Software Development Engineer at Amazon Advertising
 Scott StadumFounder and Marketing Director, Alameda Marketing Co.
Lead With Choices and Caveats
When I share results, I start with the decision, then explain what we know for sure and what uncertainty keeps us from saying. For example, in Alameda Marketing Co.'s October 26 review, traffic and event counts dropped. But a QA fix on October 24 meant we couldn't compare the numbers directly, and the inquiry feed only covered part of the past data. I reported what we actually saw, marked conversion evidence as unavailable instead of zero, and suggested we keep the current channel and offer mix steady for another week to get a clean read. This approach helps us make a practical choice without overreacting or treating an estimate as a fact. I check whether someone reading the report can repeat both the decision and the main caveat after one read.
 Venkat Chandrasekar Subramaniam FRMSenior Business Analyst, Financial Regulatory and Risk Reporting
Alert Leaders Early, Then Update
I prefer to go direct with what I know. The earlier we communicate, the better. This also helps the stakeholders get prepared for what is in store.
The reason behind my decision is that I have heard leaders continuously say "Bring the problem , early to me and I can help you solve it with the least negative impact" . I have seen that practically in my career as well. Also I believe in speaking up instead of glossing over the problem . This helps bring you as someone forthright and who will always present the truth and is not someone who is a smooth talker.
To ensure that it is just an estimate and not a fact, I would say I would come back to you when circumstances change. This is something almost everyone forgets . So circling back to the stakeholder on changes of assumptions and changes in ground reality is one of the most important aspects of communication. In case of passive channels like email or chat, it is also important to confirm that the stakeholder has read the message since senior stakeholders have multiple priorities and a message can slip their mind.
 Nikita KothariSenior MTS, Salesforce
Frame Variance Around Executive Choices
To decide how much uncertainty to communicate without overwhelming stakeholders, focus exclusively on how the variance impacts the final decision threshold rather than exposing raw statistical noise. Stakeholders rarely need full distributions or granular confidence intervals; they need to know whether the uncertainty alters the primary choice, shifts the timing, or requires a contingency plan.
A practical communication approach that prevents stakeholders from treating an estimate as a single point of truth is framing numbers using decision-driven scenario bands paired with operational triggers. Instead of presenting a static point estimate or a vague percentage range, present an expected baseline alongside high- and low-end scenarios tied directly to concrete actions. For example, explicitly defining what action leadership takes if a metric hits the optimistic bound versus what safety measures trigger if it falls to the conservative bound shifts the conversation from false precision to risk management. When stakeholders see how the decision boundaries change across scenarios, they naturally evaluate the data as a range of possibilities rather than a precise prediction.
This approach balances transparency with clarity, giving leadership the context needed to make informed risk tradeoffs without getting bogged down in statistical details. The main benefit of communicating uncertainty through decision thresholds is that it transforms analytical ambiguity into actionable strategic options. The main risk is that stakeholders looking for quick answers may push back against ranges, demanding a single number to simplify their planning assumptions. When rolling this out, teams should watch out for over-engineering scenario models; focus only on the few variables that actually shift executive decisions. In my experience, pairing metric confidence scoring with explicit decision thresholds allowed our engineering and platform leads to move forward on strategic deployments without treating initial baseline projections as absolute promises.
 Jonluke DavisFounder, Data's Alpha Circle
Size Bets Against Acceptable Losses
I give people one range and one line that would prove me wrong. That's about all the uncertainty a busy reader can hold. In trading, every level I draw is an estimate of where buyers might step in, so I write it as a zone, say what I'd do if price gets there, and name the price where I'm out.
The pattern I see over and over is that a single clean number gets repeated like a fact by the second conversation. People forget it was a guess. When the same estimate comes with a range and an exit, they start asking what happens at the edges, which is a much better question.
I'd cap the caveats at the two or three that would change what someone does. Anything that wouldn't change the action goes in a footnote or gets dropped. Long lists of what could go wrong get skimmed, and then the one that mattered gets skimmed with the rest.
Sizing is how I keep an estimate from running the show. I decide the loss I can live with first, say 1% of your account, and work backward to the position size. If the estimate turns out wrong, the damage was agreed on before anyone got attached to the number. A business can do the same with a forecast: set the loss you'd accept, then let the estimate size the bet.
 Conor SmartDirector, Arklavo
Link Delivery Windows to Reorders
"If we expect this shipment to take somewhere between 20 and 30 days, then we reorder now."
Uncertainty communicated with ranges (and not single, falsely precise numbers like 24) paired with an action feels empowering.
As the Director of a self-funded apparel company, I have to make decisions based on estimates all the time, from how much blank garments will cost next quarter to how quickly a new style will sell.
Our shipping policy offers delivery timeframes for each region because we don't control how long it will take the carriers to deliver a package. If we quoted a specific delivery time, it would feel authoritative when it's really just a guess.
The exception is when it's helpful to call out the variables that could dramatically impact the accuracy of the estimate.
For example, "This is our best guess, but if the price of materials goes up significantly (more than a few percent) from our suppliers, we'd have to revise this estimate."
There's a fine line between providing helpful context and caveating yourself into paralysis for your audience. Try to think of one variable that, if it changed significantly, would change your estimate. Call that out specifically.
 Dr. Yogesh SabnisSenior Technical Program Manager
Pause Weak Models, Then Interview Customers
When I share the information with the leadership, I primarily focus on 3 things. Things which we know of, things which we are unsure about and the things which needs discussion. I have found that in many cases, the data doesn't give the clear picture and needs discussion with the team.
I faced a similar situation when I was working on a customer retention initiative. This initiative involved predictive modeling. We were primarily comparing model predictions against actual customer behavior over several 30 day periods. The initial results weren't reliable enough based on what we wanted to achieve, so we decided to pause the experiment and investigate further.
We found out that some customers were using the product less frequently compared to others, but the data wasn't able to tell us why that was the case. Rather than make assumptions, we decided to speak directly with customers with a series of customer interviews.
Our team conducted around 10 to 15 customer interviews, and I personally presented the findings to leadership. Those conversations helped us understand things which we were not able to see in the usage data. I also worked very closely with our data scientists and product managers to discuss what we had learned and also to identify potential improvements to the model and customer experience.
I made one point pretty clear before the customer interviews. I shared that it could help us understand possible reasons behind the behavior, but they cannot tell us whether the model would accurately predict what customers would do across the entire customer base. We still needed to validate that through further testing.
What I've learned from this experience as well as other similar experiences is that the leaders appreciate clarity about uncertainty. If the evidence isn't strong enough to support a decision, I try to follow this structure. I first explain why, then what we can still move forward with, and finally what we need to validate before going further. That helps the team make informed decisions without treating every prediction as a confirmed fact.
 Kaavya TatavarthyDirector, Strategic Analytics & AI, Arch Capital Group
Share Deployment Risks With Reassurance
Best approach would be to balance transparency and focus on sharing the uncertainties that affect stakeholder decisions while packaging them into clear ranges, next steps, and contingency plans so teams stay informed without becoming overwhelmed. Based on my experience with a web-based application deployments which often involve variable rollout timing, dependency risks, and performance unknowns - for example, an API interface or a feature whose load impact is still being tested while UAT is on-going due to tight deadlines. Communicating these unplanned/delayed activities beforehand would improve the trust, also provide the confidence on what we are trying to achieve before deployment to avoid unexpected issues after go-live.
I use a simple decision methodology similar to information decision matrix and answer the questions in my mind before communicating anything with the stakeholders 1. Does this uncertainty affect stakeholder planning and relationship? 2. Is the Decision final? Is there a possibility of a workaround? 3. Could sharing this cause unnecessary worry? 4. Am I sharing excessive details?
As a result, the below communication approach worked - "I want to give a quick update on the API interface. Our load testing is still in progress while UAT continues. This testing is important because it confirms the system can handle expected production traffic and helps us avoid performance issues after go-live. At this point, UAT activities are not affected. Once the load testing is complete, we'll share the load/performance metrics and any recommended adjustments. We expect to finish by Friday and will provide a detailed update in Monday's go no-go meeting. If anything, significant comes up sooner, we'll communicate immediately."
This approach worked because it combined transparency with reassurance.